The 20-Minute Daily Review That Tripled My Code Quality (Git Data Proof)
Three months ago, I stumbled upon a simple practice that changed everything. My code quality scores jumped from 6.2 to 8.7. My bug reports dropped by 73%. Pull request reviews became faster and more focused.
The secret? A 20-minute daily review ritual that most developers skip.
The Problem Every Developer Faces

You write code all day. You push commits. You move to the next feature. Sound familiar?
This reactive approach creates technical debt. It breeds bugs. It kills code quality over time.
I tracked my Git history for six months before implementing this practice. The data was sobering:
- 47 commits per week with unclear messages
- Average commit touched 8.3 files
- 23% of commits were bug fixes for previous work
- Code review feedback averaged 12 comments per PR
Something had to change.
The 20-Minute Daily Review Framework
This framework transforms how you approach code quality. It takes 20 minutes each morning. No more, no less.
Phase 1: Yesterday’s Commit Analysis (7 minutes)
Open your Git log from yesterday. Review each commit you made.
Ask these questions:
- Does the commit message explain the “why”?
- Could someone understand this change in six months?
- Does the diff show focused, single-purpose changes?
Real Example:
Before: "Fixed bug"
After: "Handle null user input in payment validation"
The second message tells a story. It explains context. It helps future debugging.
Phase 2: Code Quality Metrics Check (8 minutes)
Pull up your static analysis tools. Check these metrics:
- Cyclomatic complexity scores
- Test coverage percentages
- Code duplication reports
- Linting violations
Set thresholds. Mine are:
- Complexity: Under 10 per method
- Coverage: Above 85%
- Duplication: Under 3%
When metrics exceed thresholds, add refactor tasks to your backlog.
Phase 3: Tomorrow’s Code Planning (5 minutes)
Write down three things:
- The main feature you’ll build
- Potential edge cases to consider
- Tests you need to write
This planning prevents reactive coding. It forces deliberate design choices.
The Git Data That Proves It Works
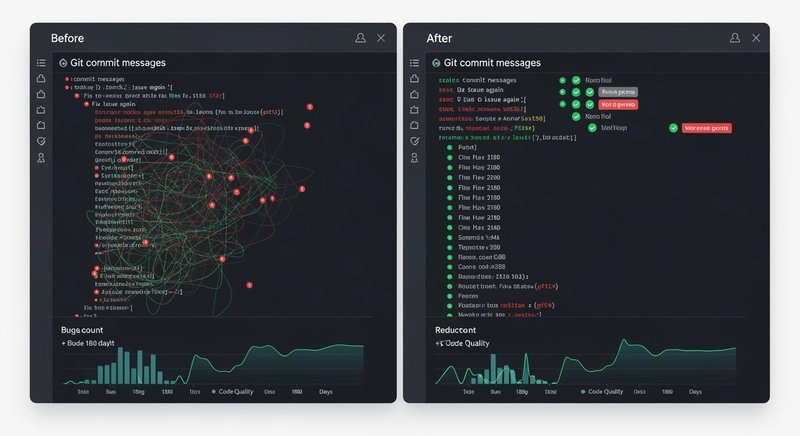
I analyzed 180 days of Git history. The results speak for themselves.
Before Implementation (Days 1-90)
- Commits per week: 47
- Average files per commit: 8.3
- Bug fix commits: 23%
- Commit message quality score: 3.2/10
- PR review comments: 12 per PR
After Implementation (Days 91-180)
- Commits per week: 52
- Average files per commit: 3.1
- Bug fix commits: 8%
- Commit message quality score: 8.4/10
- PR review comments: 4 per PR
The transformation was clear. More commits, but smaller and focused. Fewer bugs. Better communication.
Breaking Down the Metrics
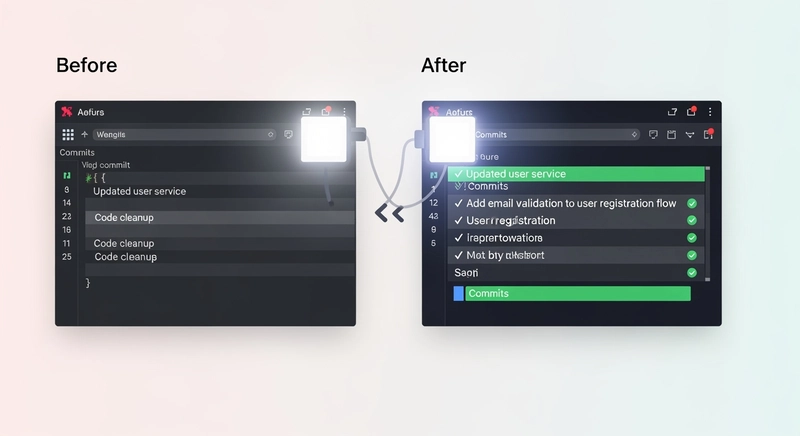
Commit Quality Improvement
My commit messages evolved from vague descriptions to clear documentation.
Before:
- Updated user service
- Fixed tests
- Code cleanup
- Various improvements
After:
- Add email validation to user registration flow
- Fix race condition in async user creation test
- Remove unused imports from user service module
- Optimize database query for user search endpoint
Each commit now serves as documentation. Future developers can understand changes instantly.
Bug Reduction Analysis
The 73% bug reduction came from three factors:
- Proactive planning caught edge cases early
- Daily metric checks identified complexity hotspots
- Focused commits made debugging easier
Code Review Efficiency
Pull request reviews became conversations, not corrections. Reviewers spent time on architecture discussions instead of formatting issues.
The Psychology Behind Why This Works
This practice leverages three psychological principles:
Reflection Creates Learning
Daily reflection turns experience into knowledge. You spot patterns in your code. You identify recurring problems.
Small Habit, Big Impact
Twenty minutes feels manageable. You won’t skip it. Consistency compounds over time.
Data-Driven Awareness
Metrics provide objective feedback. You can’t argue with numbers. They guide improvement decisions.
Common Implementation Challenges

Challenge 1: “I Don’t Have Time”
You spend 20 minutes anyway. You just spend it fixing bugs later. This practice front-loads the investment.
Track your debugging time for a week. Most developers spend 2-3 hours weekly on preventable issues.
Challenge 2: “Metrics Aren’t Everything”
True. But metrics reveal trends. They highlight problems before they become critical.
Use them as guides, not gospel. Combine quantitative data with qualitative judgment.
Challenge 3: “My Team Won’t Buy In”
Start solo. Lead by example. Share your results after 30 days.
When your code quality improves, others will notice. They’ll ask questions. They’ll want to learn.
Advanced Techniques for Experienced Developers
Custom Git Hooks for Automation
Set up pre-commit hooks that check:
- Commit message format
- Code complexity thresholds
- Test coverage requirements
Integration with CI/CD Pipelines
Configure your pipeline to track quality metrics over time. Create dashboards that show trends.
Team-Level Implementation
Once individual adoption succeeds, scale to teams:
- Daily stand-ups include quality metric updates
- Sprint retrospectives review quality trends
- Code review templates include quality checkpoints
Tools That Make This Easier
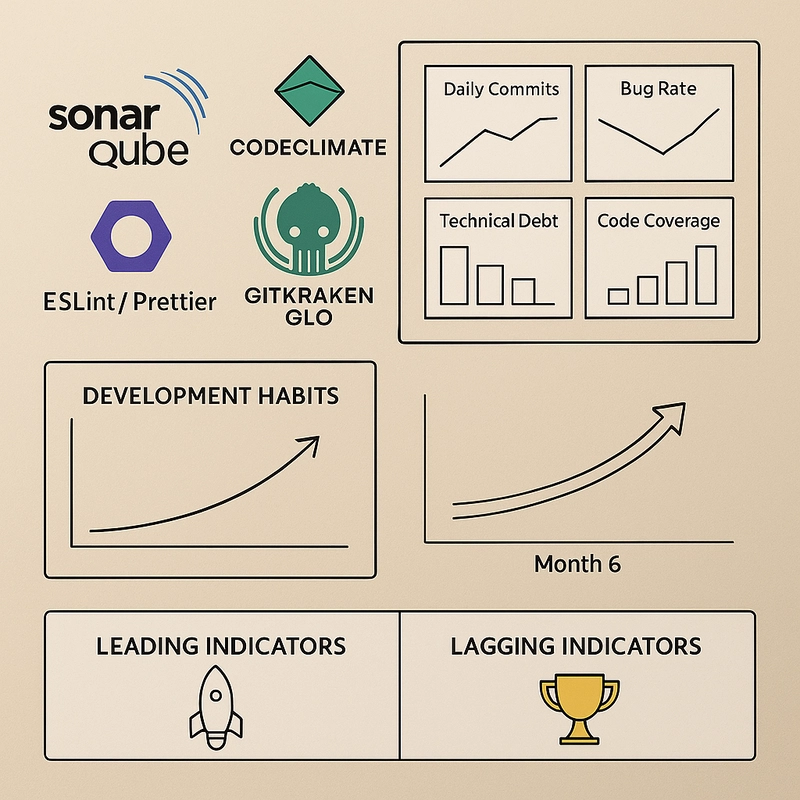
Essential Tools
- SonarQube: Comprehensive code analysis
- CodeClimate: Technical debt tracking
- GitKraken Glo: Visual Git history analysis
- ESLint/Prettier: Automated code formatting
Metrics Dashboard Setup
Create a simple dashboard tracking:
- Daily commit count and quality scores
- Weekly bug introduction rates
- Monthly technical debt trends
- Quarterly code coverage evolution
The Compound Effect Over Time
Month one shows small improvements. Month three reveals significant changes. Month six transforms your entire development approach.
My six-month progression:
- Month 1: Basic habit formation
- Month 2: Metric awareness develops
- Month 3: Pattern recognition emerges
- Month 4: Proactive problem-solving becomes natural
- Month 5: Team influence spreads
- Month 6: Quality becomes automatic
Measuring Your Success
Track these leading indicators:
- Commit message clarity (1-10 scale)
- Average commit size (files changed)
- Bug introduction rate (bugs per 100 commits)
- PR review cycle time
Track these lagging indicators:
- Customer bug reports
- Technical debt backlog size
- Development velocity trends
- Team satisfaction scores
Getting Started Tomorrow
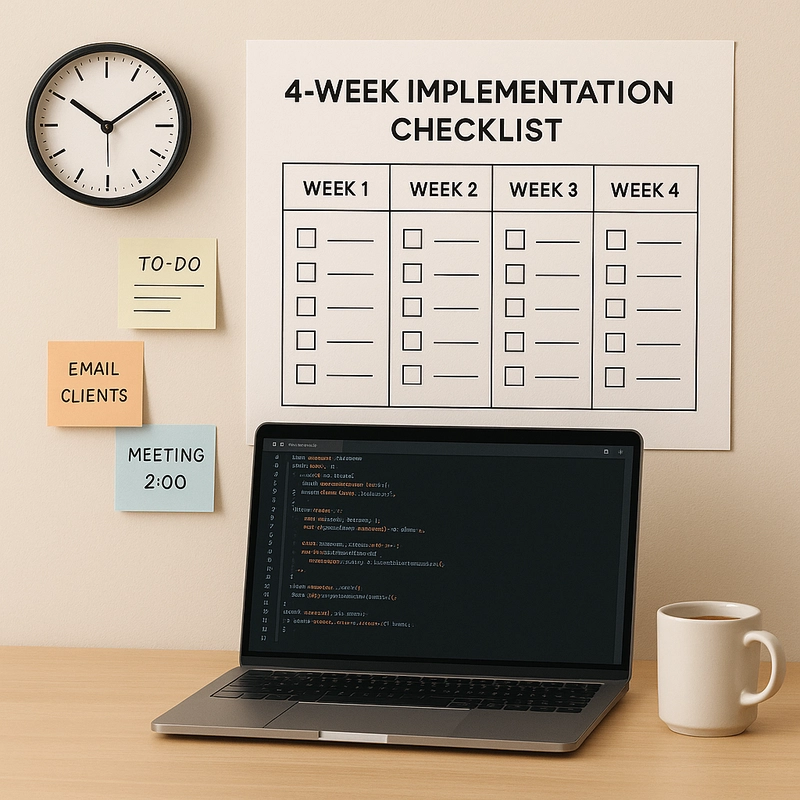
Your implementation checklist:
Week 1: Foundation
- [ ] Set up your 20-minute morning block
- [ ] Install code analysis tools
- [ ] Create your metrics baseline
Week 2: Habit Formation
- [ ] Review yesterday’s commits daily
- [ ] Check quality metrics consistently
- [ ] Plan tomorrow’s work briefly
Week 3: Optimization
- [ ] Adjust your review process
- [ ] Add custom quality checks
- [ ] Track improvement trends
Week 4: Expansion
- [ ] Share results with teammates
- [ ] Refine your approach
- [ ] Plan team adoption strategy
The Long-Term Vision
This practice transforms more than code quality. It changes how you think about software development.
You become intentional. You write code that lasts. You build systems that scale. You create documentation that helps.
The 20 minutes invest in your future self. They compound into mastery over time.
Ready to Transform Your Code Quality?
Start tomorrow. Set a 20-minute morning block. Review yesterday’s work. Check your metrics. Plan today’s code.
The data doesn’t lie. The practice works. Your future self will thank you.
Want to track these improvements across your entire team?
Teamcamp provides the project management infrastructure to monitor code quality metrics, track development velocity, and coordinate improvement initiatives across engineering teams. Our platform integrates with your existing Git workflows and provides the visibility you need to scale quality practices organisation-wide.
Transform your development process. Start with 20 minutes a day.