Server-rendered Maps for Web and Mobile
A Developer’s Guide to the Mapbox Static Images API
Interactive maps are a powerful user experience element — they let users pan, zoom, and explore wide geographic areas or interact with dense datasets. But there’s a catch: not every use case needs the full weight of a client-rendered map.
Rendering vector maps in the client requires loading all the map data into the browser or device, which means significant network traffic, device processing overhead, and performance costs.
Sometimes you just need a picture of a map.
If users are quickly scrolling past location information, or if you’re displaying a long list where every item needs a map thumbnail, it doesn’t make sense to bring in a vector map library or SDK and load lots of client-rendered data just to show a marker or two.
That’s where the Mapbox Static Images API comes in.
What Is the Static Images API?
The Mapbox Static Images API is an HTTP endpoint that returns map images. All you need is a center point (latitude and longitude) and a zoom level (0 is zoomed out to world level, 18 or so gets you to street level). This will serve up a beautiful map image from anywhere in the world — no JavaScript libraries, no SDK packages, no client-side rendering, just a clean image URL.
To help you get an understanding of the URL structure for a call to the Static Images API, here are some map images of landmarks and their associated Static Images API URLs. You can try the URLs yourself, just replace YOUR_MAPBOX_ACCESS_TOKEN with an access token from your Mapbox account:
The Eiffel Tower
The site of the Eiffel Tower in Paris (2.295,48.8584), France, using the Mapbox Streets style at zoom 12.77:
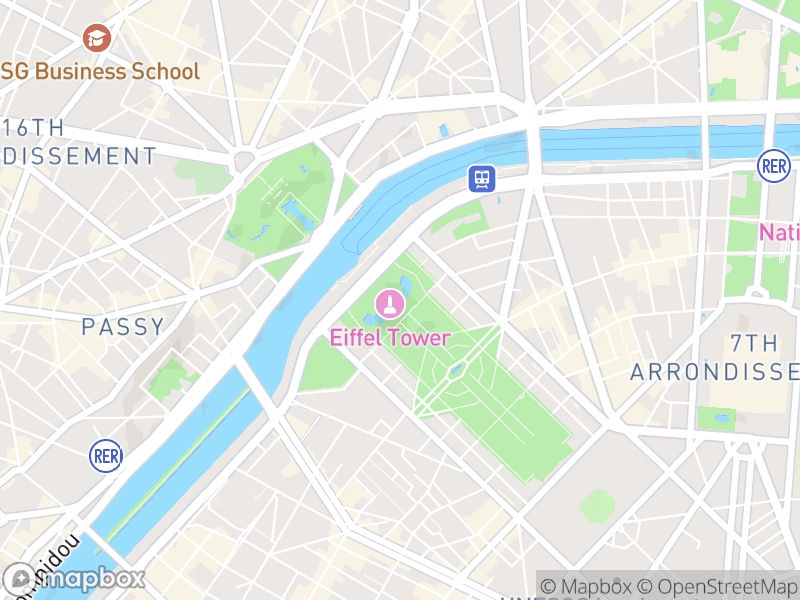
https://api.mapbox.com/styles/v1/mapbox/streets-v12/static/2.295,48.8584,12.77,0/400x300@2x?access_token=YOUR_MAPBOX_ACCESS_TOKEN
The site of the Golden Gate Bridge (-122.4717,37.8177) in San Francisco, California, USA, using the Mapbox Dark style at zoom 10.56:
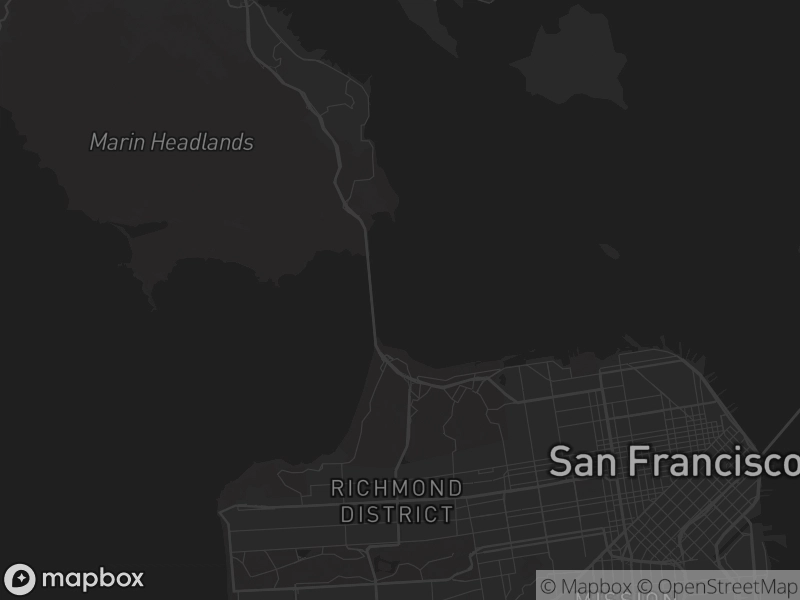
https://api.mapbox.com/styles/v1/mapbox/dark-v11/static/-122.4717,37.8177,10.56,0/400x300@2x?access_token=YOUR_MAPBOX_ACCESS_TOKEN
The site of the Sydney Opera House in Sydney, Australia, using the Mapbox Satellite Streets style at zoom 13.63.
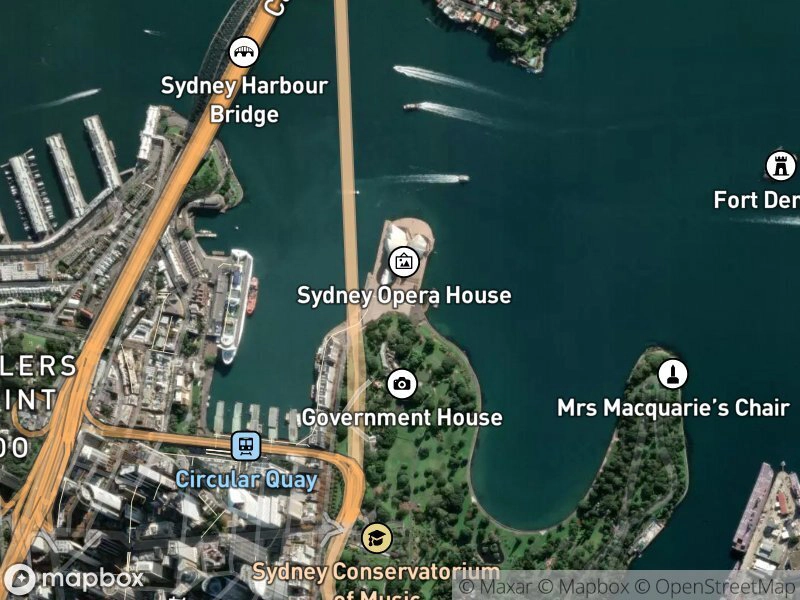
https://api.mapbox.com/styles/v1/mapbox/satellite-streets-v12/static/151.215,-33.858,13.63,0/400x300@2x?access_token=YOUR_MAPBOX_ACCESS_TOKEN
As you can see, the syntax for the URL structure is straightforward. Each of these images is 800×600 pixels (the request shows 400x300@2x for retina images), and include the longitude, latitude, zoom level, and style id.
You can copy the URLs, add your own Mapbox access token and change out the longitude and latitude coordinates to get a map image for an area of interest to you. If you need to quickly get coordinates for a place, try our handy Location Helper tool.
Adding Your Data with Overlays
It’s rare that you would ever want just a basemap. The real power of the Static Images API comes from its overlays feature. Overlays let you add your own data — markers, lines, and polygons — directly onto the map.
The overlay system is completely flexible: you can use simple longitude and latitude coordinates, or bring in encoded linestrings or GeoJSON for more complex geometries. This makes it trivial to combine Mapbox’s professional basemaps with your application’s location data.
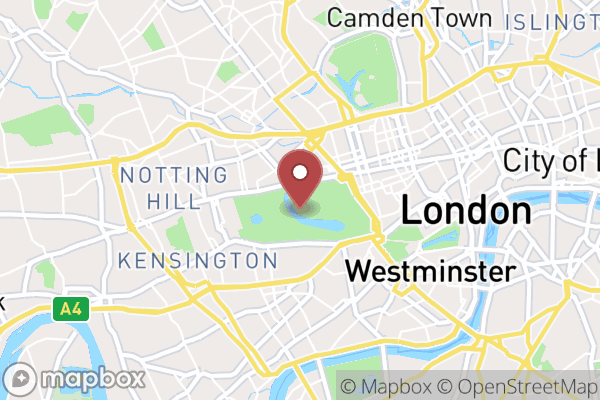
Overlays use a DSL and end up as sections of the URL. For example, a small (s) red (#b44646) marker at coordinates -0.1717,51.5068 is encoded as pin-s+b44646(-0.1717,51.5068). Don’t worry about the learning curve for encoding overlays, we made a Developer Playground to help you configure them.
Three Real-World Use Cases
Below are three practical examples that showcase how to combine Mapbox basemaps with overlays from the Static Images API.
1. Directions Route with Origin and Destination Markers
A common use cases in location apps is showing directions and travel times from point A to point B. Whether you’re building a ride-sharing app, a delivery service, or a travel planner, you need to visualize routes clearly.
With the Static Images API, you can overlay a route polyline along with markers for the origin and destination. This gives users an instant visual understanding of the journey without requiring them to interact with a full map.
Example:
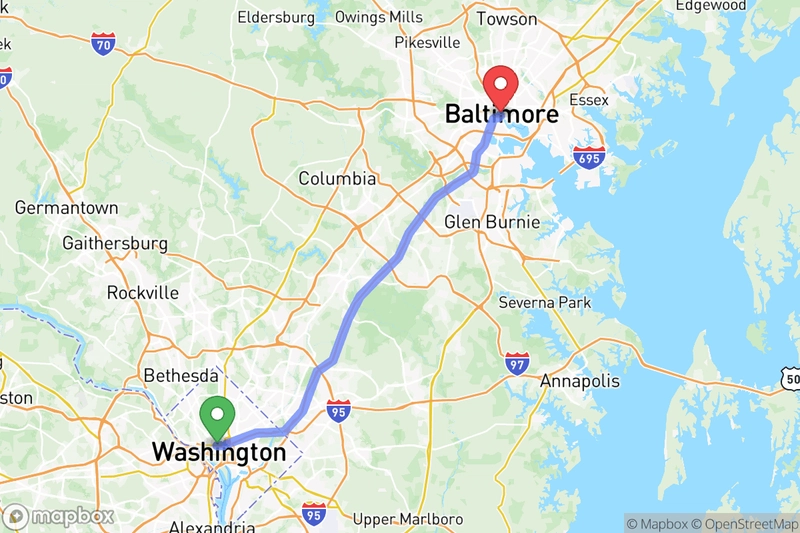
https://api.mapbox.com/styles/v1/mapbox/streets-v12/static/path-7+6d8afd-0.8(ycmlFdweuM%3FglAsF%40B_CirAi%7CGkHyfG%7ByCspD%7B%7DGyfCyrAgsCenHcoCgbDylBiaHgkJ_lDabB_fGszFuxDqeJ%7BfCw%5Bq%7C%40%7BcAwcEczA_Aa%7D%40aR%5C%5C%3F),pin-l+51bd5e(-77.0393863890253,38.90253),pin-l+f54747(-76.612299,39.289643)/-76.7636,39.1125,8.45,0/600x400@2x?attribution=true&logo=true&access_token=YOUR_MAPBOX_ACCESS_TOKEN
- Use an encoded polyline overlay for the route geometry (The Mapbox Directions API can return this format, that’s where the geometry in this example came from)
- Add marker overlays for origin and destination with different colors
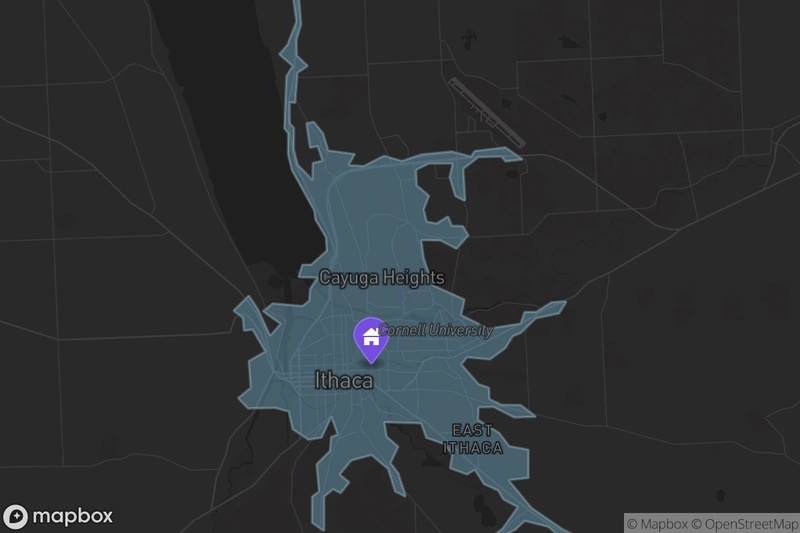
2. Property Listing with 15-Minute Accessibility Isochrone
Real estate and rental platforms need to communicate location value effectively. Showing a home’s location is helpful, but showing what’s accessible from that location is even better.
An isochrone is a polygon that represents all the areas reachable from a point within a certain time frame. (We have an API for that too!) For a property listing, overlaying a 15-minute isochrone shows potential buyers or renters exactly how far they can get by walking, biking, or driving — highlighting the home’s convenience and accessibility.
This approach could also show the delivery area for a business or any other relevant polygon like a school district.
Example:
https://api.mapbox.com/styles/v1/mapbox/dark-v11/static/geojson({"type":"FeatureCollection","features":[{"type":"Feature","geometry":{"type":"Polygon","coordinates":[[[-76.508577,42.514225],[-76.509957,42.513128],[-76.509123,42.508674],[-76.51144,42.504265],[-76.513577,42.502387],[-76.510127,42.500128],[-76.511751,42.498128],[-76.512271,42.488128],[-76.511283,42.487128],[-76.511306,42.483128],[-76.510324,42.480128],[-76.504437,42.472268],[-76.504167,42.470538],[-76.50139,42.467128],[-76.501189,42.464516],[-76.505282,42.461833],[-76.507577,42.46181],[-76.508577,42.459468],[-76.503577,42.45937],[-76.505579,42.457126],[-76.505802,42.454903],[-76.507577,42.453848],[-76.515345,42.45436],[-76.51784,42.452865],[-76.513262,42.450444],[-76.515998,42.448128],[-76.519319,42.453386],[-76.521577,42.455901],[-76.525577,42.452965],[-76.523118,42.451587],[-76.522831,42.449128],[-76.520577,42.449318],[-76.517225,42.445128],[-76.521577,42.443245],[-76.521074,42.438128],[-76.524371,42.436128],[-76.521759,42.434128],[-76.514694,42.434245],[-76.511158,42.433548],[-76.510105,42.430128],[-76.505996,42.428128],[-76.502577,42.428537],[-76.500033,42.432584],[-76.498334,42.429128],[-76.500068,42.428619],[-76.500394,42.425945],[-76.503844,42.423395],[-76.503226,42.418128],[-76.505035,42.417128],[-76.505053,42.412128],[-76.50193,42.410481],[-76.501943,42.417128],[-76.499577,42.418592],[-76.497577,42.417807],[-76.495368,42.419919],[-76.497856,42.421407],[-76.494862,42.424128],[-76.489532,42.425173],[-76.485245,42.42246],[-76.483325,42.418128],[-76.480532,42.417083],[-76.482577,42.421654],[-76.484577,42.423622],[-76.482577,42.426795],[-76.485577,42.428684],[-76.486205,42.4315],[-76.476577,42.43128],[-76.475212,42.428493],[-76.470462,42.427243],[-76.468432,42.425273],[-76.469064,42.422641],[-76.464577,42.42142],[-76.462577,42.422323],[-76.460151,42.419554],[-76.456427,42.418278],[-76.455088,42.416617],[-76.451321,42.415128],[-76.455346,42.410897],[-76.459955,42.408506],[-76.458864,42.407414],[-76.455822,42.409373],[-76.451921,42.410785],[-76.449577,42.412473],[-76.443373,42.411332],[-76.437577,42.4076],[-76.436152,42.409554],[-76.439795,42.41091],[-76.447756,42.414949],[-76.453774,42.420325],[-76.448577,42.420775],[-76.448577,42.426175],[-76.453577,42.426839],[-76.456253,42.429452],[-76.461745,42.43196],[-76.461577,42.434379],[-76.457577,42.434404],[-76.4523,42.432406],[-76.446577,42.432548],[-76.450577,42.434781],[-76.455577,42.434836],[-76.458759,42.435946],[-76.458898,42.438128],[-76.461577,42.438809],[-76.466099,42.442606],[-76.464577,42.444003],[-76.458577,42.443598],[-76.454577,42.44578],[-76.452594,42.448111],[-76.450577,42.448707],[-76.446577,42.45155],[-76.440577,42.452472],[-76.438577,42.454801],[-76.442577,42.454598],[-76.446577,42.452706],[-76.449577,42.452709],[-76.450577,42.45048],[-76.45896,42.449511],[-76.466132,42.452128],[-76.46527,42.455128],[-76.473577,42.457868],[-76.475924,42.463128],[-76.476577,42.466596],[-76.471577,42.466572],[-76.467379,42.46493],[-76.464225,42.46748],[-76.465716,42.469267],[-76.468577,42.469357],[-76.469577,42.471132],[-76.472577,42.46976],[-76.475128,42.470128],[-76.475922,42.472473],[-76.474547,42.475128],[-76.477756,42.477128],[-76.477876,42.480128],[-76.474577,42.481343],[-76.468331,42.481374],[-76.469151,42.478702],[-76.467634,42.475071],[-76.4651,42.474128],[-76.465577,42.480314],[-76.461577,42.482593],[-76.455577,42.482704],[-76.454577,42.481743],[-76.450052,42.482128],[-76.454577,42.484442],[-76.462577,42.483733],[-76.463577,42.482681],[-76.468577,42.483644],[-76.476577,42.483066],[-76.481577,42.481804],[-76.486278,42.482829],[-76.491577,42.480834],[-76.495577,42.481012],[-76.493917,42.483128],[-76.500868,42.483837],[-76.502166,42.487128],[-76.504577,42.48936],[-76.506515,42.489128],[-76.505577,42.484372],[-76.503577,42.48469],[-76.502328,42.481879],[-76.504875,42.481426],[-76.504915,42.478128],[-76.508832,42.481128],[-76.50985,42.484128],[-76.509782,42.488128],[-76.510887,42.489128],[-76.510926,42.493128],[-76.509491,42.493042],[-76.508864,42.498841],[-76.506173,42.500128],[-76.509066,42.502128],[-76.509133,42.505128],[-76.507936,42.508128],[-76.508577,42.514225]]]},"properties":{"fill-opacity":0.33,"opacity":0.33,"fill":"%237dcff5","fillOpacity":0.33,"color":"%23bf4040","contour":10,"metric":"time"}}]}),pin-l-home+744ce1(-76.48957711003335,42.44212800096554)/-76.4821,42.4615,10.98,0/600x400@2x?attribution=true&logo=true&before_layer=admin-0-boundary-bg&access_token=YOUR_MAPBOX_ACCESS_TOKEN
- Generate the isochrone polygon using the Mapbox Isochrone API
- Add it as a GeoJSON polygon overlay with a semi-transparent fill
- Place a marker overlay at the property location to clearly identify the starting point
- Use the
before_layerparameter to position overlay underneath the map labels - Use a dark basemap style to make the colors pop
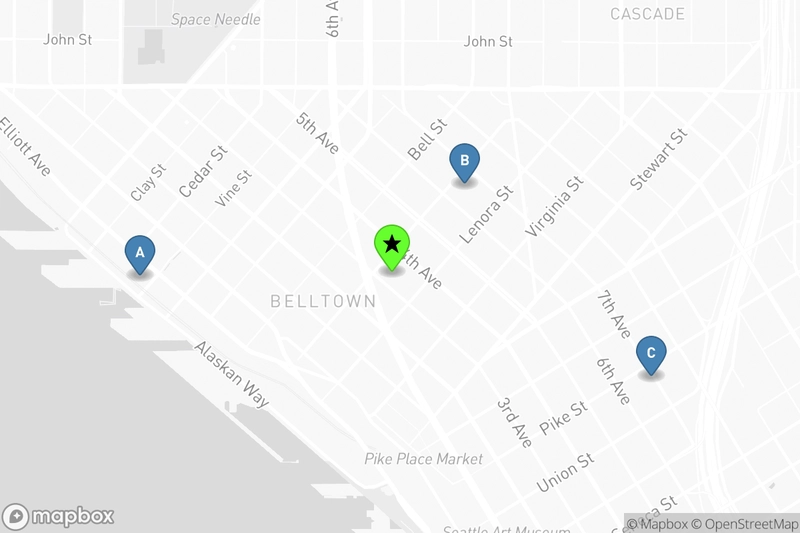
3. School Proximity Map with Labeled Markers
Parents searching for a new home often prioritize school proximity. For a real estate or neighborhood information app, showing a home’s location alongside nearby schools provides instant context about the area.
Using the Static Images API, you can overlay multiple custom markers — one for the home and one for each nearby school — with labeled markers (A, B, C) to make it easy to cross-reference with a list displayed alongside the map.
Example:
https://api.mapbox.com/styles/v1/mapbox/light-v11/static/pin-s-c+4682b4(-122.3332,47.6113),pin-s-b+4682b4(-122.3401,47.6161),pin-s-a+4682b4(-122.3521,47.6138),pin-l-star+66ff2e(-122.3428,47.6139)/-122.3425,47.6141,13.8,0/600x400@2x?attribution=true&logo=true&access_token=YOUR_MAPBOX_ACCES_TOKEN
- Use a distinct marker style for the home location
- Add labeled markers for each school with letters A, B, C (Glyphs are also available as marker labels using the
labelparameter)
Use the Developer Playground to get started
The Static Images API Playground makes it easy to get started without needing to learn the intricacies of the overlay DSL or manually dial your map in to your desired area and zoom level. The Playground provides a graphical user interface where you can easily position the map, add overlays visually, and tinker with all the API parameters in real time.
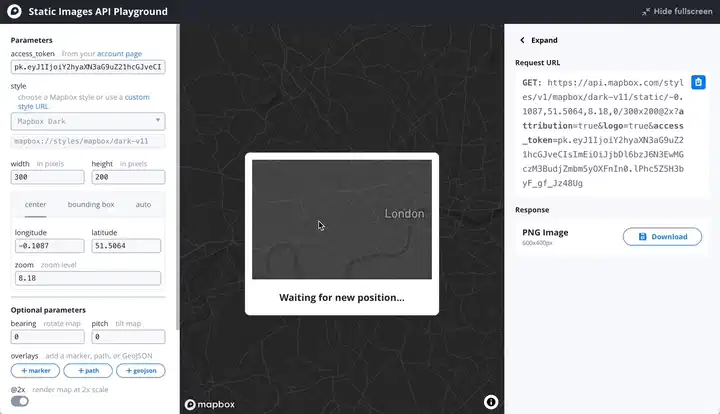
We recently improved the overlay UI to make it even simpler to add markers, lines, and polygons — just click, drag, and configure. Once your map image and overlays look exactly the way you want, simply copy the generated URL.
You can use that URL directly in your frontend code as an <img> source, or use it as a template to generate similar URLs dynamically based on your application’s data — just swap in different coordinates, zoom levels, or overlay parameters as needed.
When to Choose Static Maps
Static maps aren’t a replacement for interactive maps — they’re a complement.
Use static maps when:
- You’re displaying many maps at once (list views, galleries, grids)
- The map is supplementary context, not the primary interaction
- You need fast page loads and minimal JavaScript overhead
- You want a consistent image that won’t change based on user interaction
By combining beautiful Mapbox basemap styles with your own overlay data, the Static Images API gives you a lightweight, performant way to bring maps into your web and mobile applications — without the complexity or cost of full interactive rendering.
Ready to get started?
- Try the Static Images API Playground and see how easy it is to create custom static maps for your next project.
- See the API reference documentation for detailed breakdowns of each parameter.