🧠 Mastering VS Code Debugger for Node.js: A Real-World Guide to Fixing Production Bugs Faster 🚀
Let’s understand how we can debug in Advanced Mode.
🔎 1️⃣ Variables
👉 What is it?
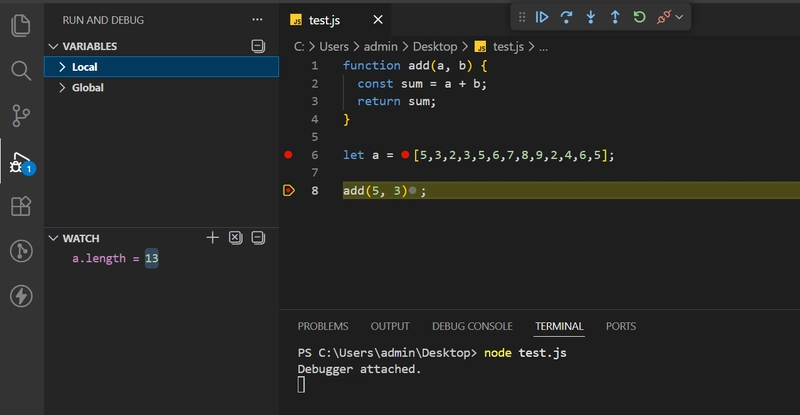
When the debugger stops at a line (breakpoint), it shows the current value of all variables at that exact moment.
👉 Example:
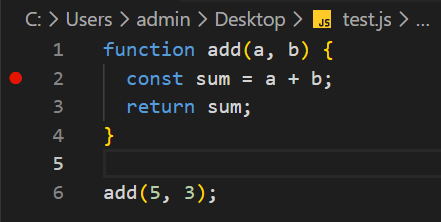
function add(a, b) {
  const sum = a + b;
  return sum;
}

add(5, 3);
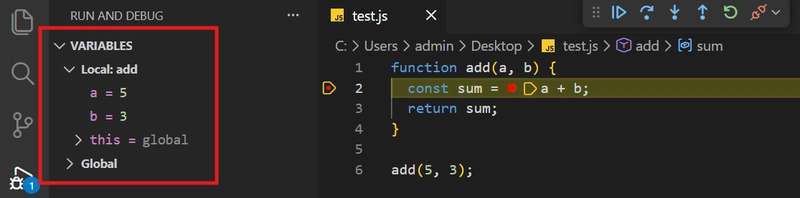
If you put a breakpoint on: const sum = a + b; ( Line 2 )
In the Variables panel, you’ll see:
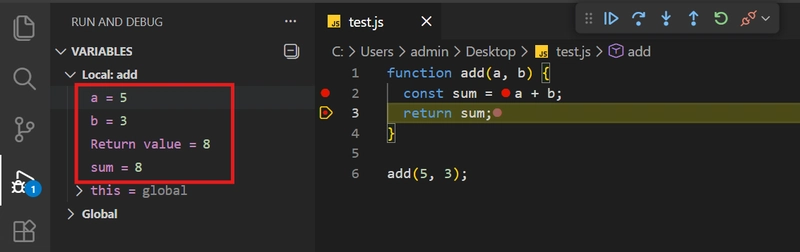
👉 What is it used for?
- To check if values are as expected
- To inspect object structure
- To examine API responses
In production debugging, this is a lifesaver.
2️⃣ Watch
👉 What is it?
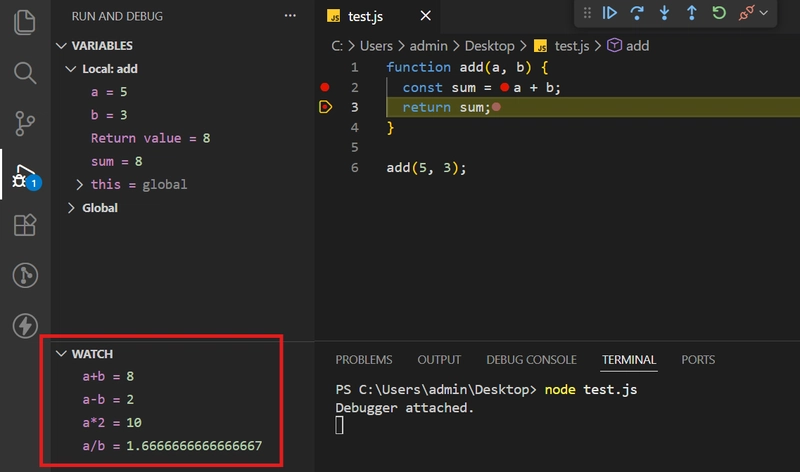
In Watch, you manually add an expression, and the debugger shows its value at every step.
Now, let’s take same example and let’s put express there and check what it’ll give output,
In this -> I added one expression that is “a+b” and Enter so output would be this,
👉 When to use it?
- When you want to track a specific variable
- When you need to repeatedly check a condition
- When inspecting deep properties inside complex objects
Another Example is,
I want to get the length of one array so just put “a.length” and we will get output,
📚 3️⃣ Call Stack
👉 What is it?
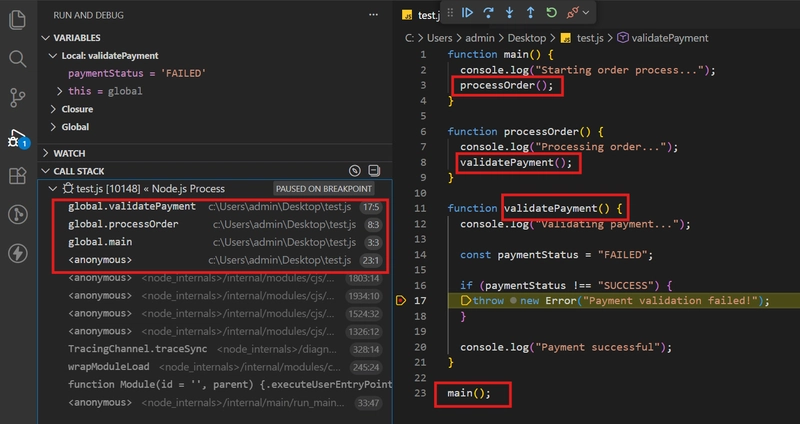
It shows the function call chain.
🔍 What This Means
The stack shows the execution path:
- main() started everything
- main() called processOrder()
- processOrder() called validatePayment()
- Error occurred inside validatePayment()
This is the exact function chain.
🎯 Why This Is Powerful
Imagine in production:
- You only see: Payment validation failed
- You don’t know which API triggered it
- You don’t know which middleware called it
Call stack tells you:
- 👉 Where the error started
- 👉 Who called it
- 👉 How execution reached there
No guessing. No extra logs.
📜 4️⃣ Loaded Scripts
👉 What is it?
It shows which JavaScript files are currently loaded in the debugger.
In a Node app, this includes:
- Your source files
- node_modules files
- Compiled/transpiled files
👉 What is it used for?
- To check if the correct file is loaded
- To verify the correct build version is running
- To debug source map issues
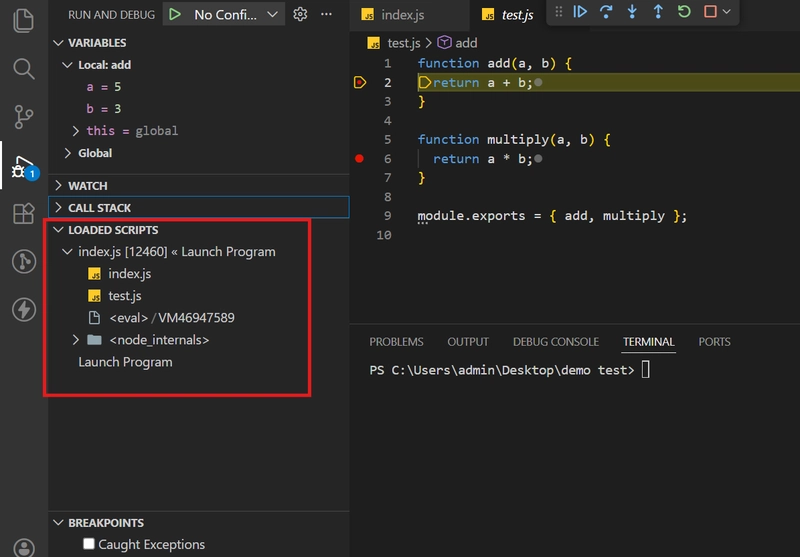
You will see:
- index.js
- math.js
- Node internal files
- Files from node_modules (if any installed)
🔍 What This Means
Loaded Scripts shows all JavaScript files currently active in memory during debugging.
In a real Node app, this includes:
- ✅ Your source files
- ✅ node_modules packages (Express, Redis, etc.)
- ✅ Internal Node.js files
- ✅ Compiled/transpiled files (if using TypeScript or Babel)
🎯 Why This Is Useful
1️⃣ Check if the Correct File Is Loaded
2️⃣ Verify Correct Build Version
3️⃣ Debug Source Map Issues (TypeScript Case)
🛑 5️⃣ Breakpoints
Let’s create one file call test.js
function getUser(id) {
  console.log("Fetching user...");

  const users = [
    { id: 1, name: "Darshan", role: "ADMIN" },
    { id: 2, name: "Rahul", role: "USER" },
  ];

  const user = users.find((u) => u.id === id);

  if (!user) {
    throw new Error("User not found");
  }

  return user;
}

function resolver(args, context) {
  console.log("Inside resolver...");

  const user = getUser(args.id);

  if (context.role !== "ADMIN") {
    throw new Error("Unauthorized access");
  }

  return user;
}

function main() {
  const args = { id: 1 };
  const context = { role: "USER" }; // Change to ADMIN later

  const result = resolver(args, context);

  console.log("Result:", result);
}

main();
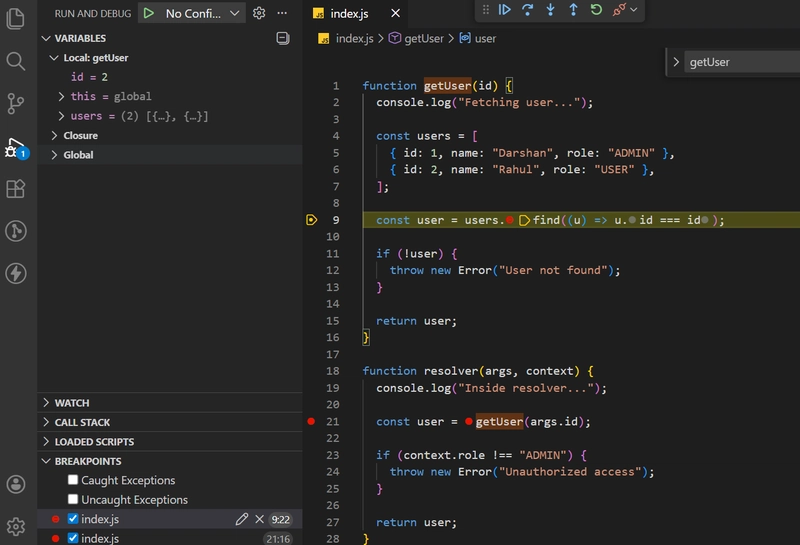
🔴 1️⃣ Normal Breakpoint
Now, put the debug point at here,
const user = getUser(args.id);
And run the code in Javascript Debug Terminal and once debug point reach to that place then you will see,
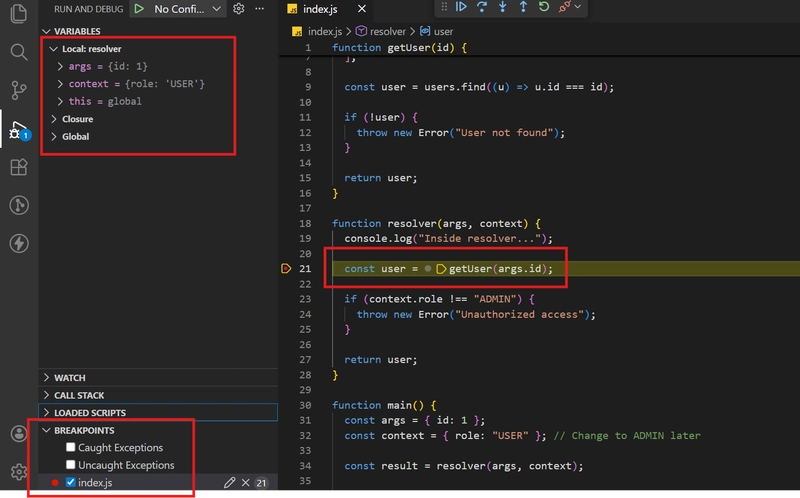
👉 Execution will stop there.
Now check:
Variables Panel:
- args
- context
You can inspect:
args = { id: 1 }
context = { role: "USER" }
Press ▶ Continue — it will move forward.
🟡 2️⃣ Conditional Breakpoint
Now put breakpoint on:
const user = users.find((u) => u.id === id);
Right-click → Add Condition:
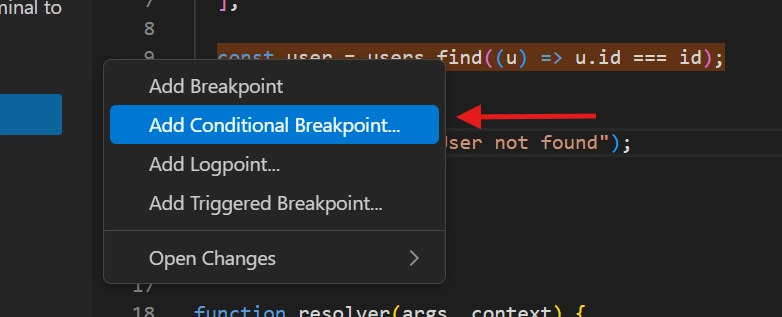
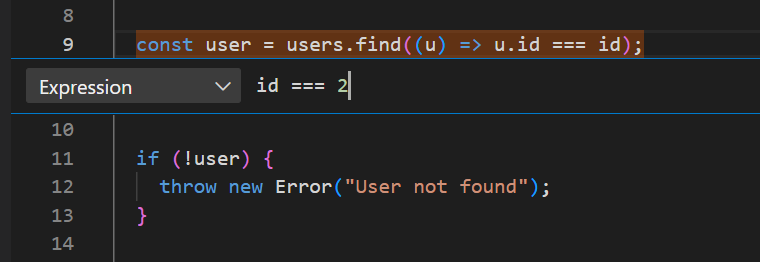
id === 2
Now change in main():
const args = { id: 2 };
Debugger will stop only when id = 2.
This is powerful in loops or bulk processing.
🎮 Debug Controls (Test Them Now)
⏭ Step Over
Moves to next line
(Does NOT enter function)
⏬ Step Into
Goes inside function
If paused at:
const user = getUser(args.id);
Press Step Into → you enter getUser.
⏫ Step Out
If you’re inside getUser, press Step Out → it exits and returns to resolver.
▶ Continue
Runs until next breakpoint or error.
Thanks 🙂