iOS Development Reimagined: From App Store Screenshots to Objective-C Code
Bridging Visuals to Objective-C Code
From App Store Screenshots to Functional Code
Ever wonder how to turn those beautiful App Store screenshots into actual, working code? It’s a challenge many iOS developers face. You’ve got this amazing design, but translating it into Objective-C can be tedious and time-consuming. It involves manually creating UI elements, setting constraints, and wiring up actions. It’s a process ripe for errors and inconsistencies.
- Manually coding UI from screenshots is slow.
- It’s easy to introduce visual discrepancies.
- Maintaining consistency across the app becomes difficult.
The traditional approach often involves a lot of back-and-forth between designers and developers, leading to delays and frustration. There’s got to be a better way, right?
Automating UI Generation with Image to Objective-C
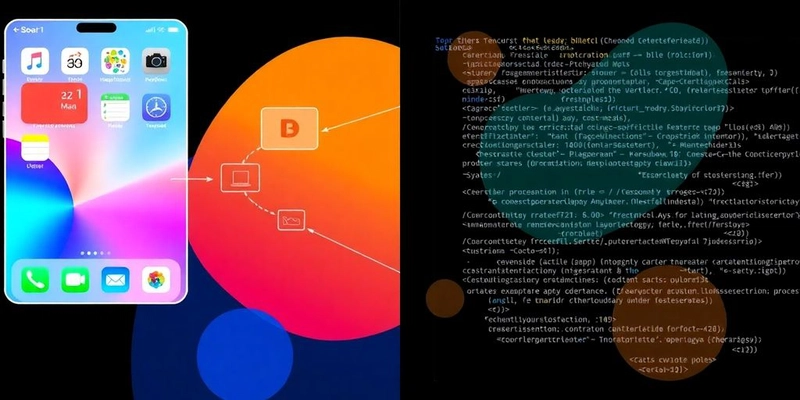
What if you could automate a big chunk of that process? That’s where tools like Codia Code – AI-Powered Pixel-Perfect UI for Web, Mobile & Desktop in Seconds come in. These tools use AI to analyze images (like those App Store screenshots) and automatically generate the corresponding Objective-C code. Think of it as magic, but with algorithms.
Here’s a simplified view of how it works:
- Upload your screenshot.
- The AI identifies UI elements (buttons, labels, etc.).
- It generates Objective-C code for those elements.
- You refine and integrate the code into your project.
| Feature | Manual Coding | AI-Powered Generation |
|---|---|---|
| Speed | Slow | Fast |
| Accuracy | Variable | High |
| Consistency | Low | High |
| Learning Curve | Low | Low |
This approach can significantly speed up development, reduce errors, and ensure visual consistency. It’s not a perfect solution – you’ll still need to tweak and customize the generated code – but it’s a huge step forward in bridging the gap between visuals and functional code.
Optimizing Performance in iOS Development
Let’s talk about making our iOS apps run smoother and faster. It’s not just about writing code that works, but writing code that works well. We’ll look at some ways to boost performance, from using dynamic libraries to understanding how memory is handled.
Leveraging Dynamic Libraries for Efficiency
Dynamic libraries can be a real game-changer. Instead of embedding all your code directly into the app, you can use dynamic libraries that are loaded at runtime. This reduces the initial size of your app, which means faster download times and less storage space used on the user’s device. Plus, if multiple apps use the same dynamic library, it only needs to be stored once on the system. It’s like sharing resources to save space and improve efficiency. You can also use tools like FengNiao to clean up unused resources in Xcode.
Here’s a quick rundown of the benefits:
- Smaller app size
- Reduced memory footprint
- Code reusability across apps
Using dynamic libraries can introduce some complexity, especially when managing dependencies and versions. It’s important to plan your architecture carefully and use versioning to avoid conflicts.
Understanding Copy-On-Write for Memory Management
Copy-on-write (COW) is a memory management technique that can significantly improve performance, especially when dealing with large data structures. The basic idea is that when you “copy” a data structure, you’re not actually creating a full copy in memory. Instead, you’re creating a new reference that points to the same underlying data. Only when you try to modify the “copy” does the system create a separate copy in memory. This can save a lot of time and memory, especially if you’re passing around large arrays or dictionaries. It’s worth understanding protocol conformances in Swift to improve app performance.
Here’s how it works:
- Initial copy creates a new reference.
- Modifications trigger a full copy.
- Memory is saved until modification occurs.
| Operation | Memory Usage | Time Complexity |
|---|---|---|
| Initial Copy | Low | O(1) |
| Modification | High | O(n) |
COW is used extensively in Swift’s standard library for types like Array, Dictionary, and String. This means that you’re probably already benefiting from it without even realizing it! However, it’s good to be aware of how it works so you can write code that takes advantage of it. For example, avoid unnecessary modifications to large data structures if you only need to read their values. Also, consider using Grand Central Dispatch instead of managing threads yourself to minimize dependence on the hardware.
Advanced Debugging and Development Workflows
Real-Time Previews and Console Output in Xcode
Debugging can be a real pain, but Xcode offers some cool tools to make it less so. One of the handiest is the real-time preview, which lets you see changes to your UI as you code. No more building and running every time you tweak a button! The console output is also super useful, especially with the new features in Xcode 15. You can filter logs, visualize data, and even use the dwim-print command to check expressions. It’s like having a superpower for finding bugs.
- See UI changes instantly.
- Filter logs for specific issues.
- Use
dwim-printfor expression evaluation.
Debugging is not just about fixing errors; it’s about understanding the flow of your application and making sure everything works together as expected. The more you know about your tools, the easier it becomes to spot and fix problems.
And speaking of tools, did you know that Xcode has a feature called mergeable libraries? It can help you ship smaller apps, which is always a win.
Streamlining Debugging with Sequential Animations
Animations can be tricky to debug. Sometimes, things happen so fast that you can’t see what’s going wrong. That’s where sequential animations come in handy. By slowing down or stepping through animations, you can get a better look at each frame and identify any issues. It’s like having a slow-motion replay for your code. Plus, Xcode’s debugging tools let you attach to a running process, which is great for debugging apps that launch in response to external events. Here’s a quick rundown:
- Set breakpoints in your animation code.
- Use the debugger to step through each frame.
- Inspect variables and properties to identify issues.
| Property | Value | Description |
|---|---|---|
| Duration | 0.3s | Animation length |
| Delay | 0.1s | Start delay |
| Repeat | 1 | Repeat count |
Debugging Swift with LLDB can be complex, but it’s worth learning. You can set up complex projects for debugging and dive deep into the internals of LLDB. It’s a powerful tool for understanding how your code works and finding those elusive bugs.
Want to make your coding easier and faster? Our special AI tools can help you build amazing user interfaces for websites, phones, and computers super quick. Check out how our AI Code feature can change the way you work by visiting our website today!