Set Up AWS Alerts to catch Cost Spikes and Security Risks
Surprise bills are no fun.
Running into them is almost inevitable, especially if you’re just getting started. With AWS shifting to a credit-based free tier, it’s important than ever to keep your experiments budget-friendly. In this article, I’ll walk you through how to set up simple alerts using Amazon CloudWatch to monitor:
– Unexpected charges
– Root account usage
…and there’s a challenge at the end for you to try. Let’s get started!
Using Cloudwatch to monitor Unexpected Charges
Step 1 : Enable Billing metrics
-
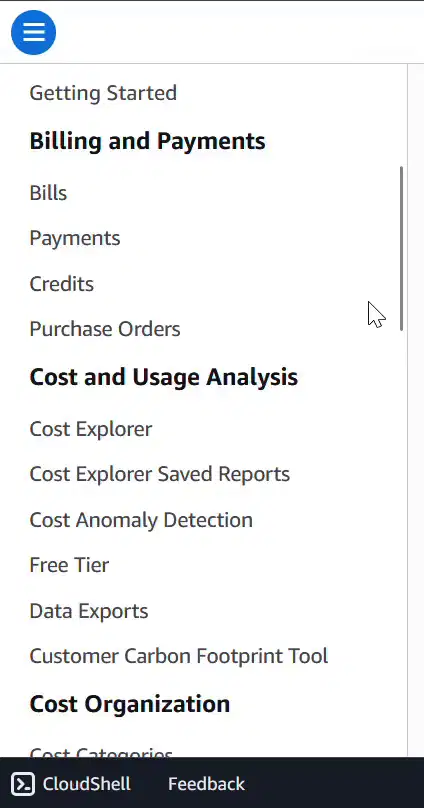
In the management console, navigate to “Billing Preferences” **under “Billing and Cost Management**”.
-
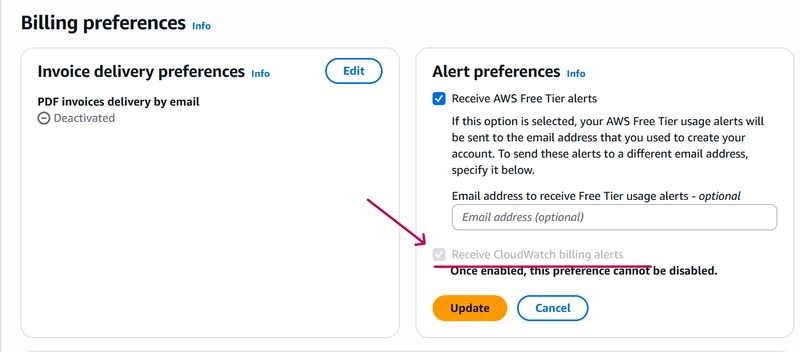
Under “Alert Preferences“, check the option to “Receive CloudWatch billing alerts”.
-
Click *Update * to confirm your changes.
Step 2: Create CloudWatch Alarm
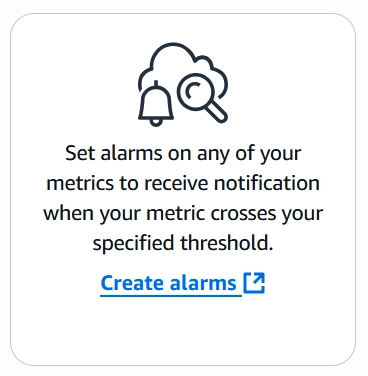
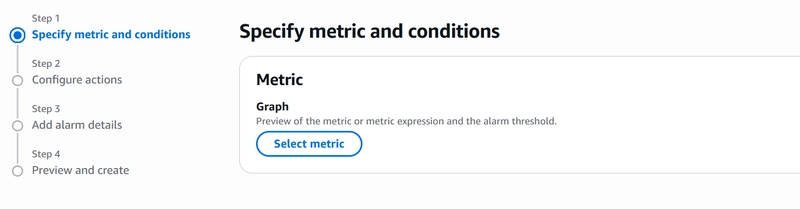
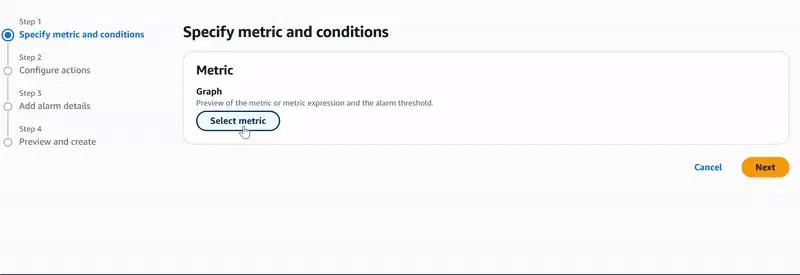
- In the console, navigate to CloudWatch and choose New Alarm.
- Under “Specify metric and conditions”, select the** “Total Estimated Charge”** metric under “Billings”.
-
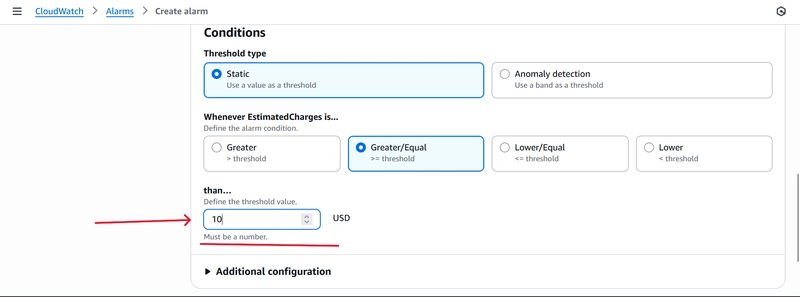
Under Conditions is where you define the criteria that will trigger your alarm. In the example below, I set the threshold value to $10. As soon as the estimated charge on my account reaches or exceeds $10, the alarm will be triggered. Adjust this threshold to a value that suits your needs.
-
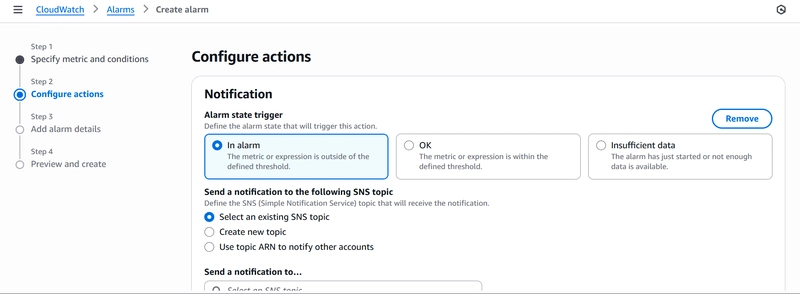
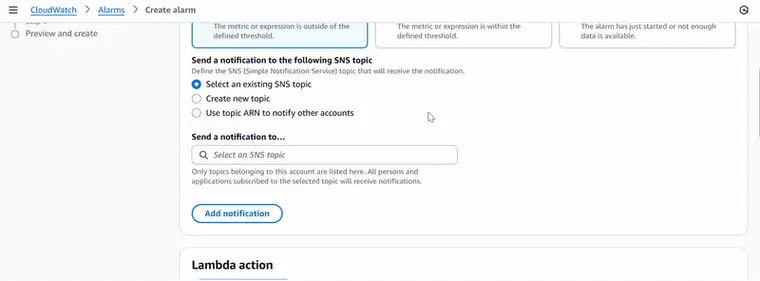
Next, we go to “Step 2: Configure actions“. Here, we define what happens when the alarm is triggered. In our case, we want a notification delivered to us. For the alarm state trigger, we use “In Alarm” option.
-
The notification is delivered via Email through Amazon SNS ( Simple Notification Service). If you do not have an SNS topic set up, you can create one within this step with an active email address. We leave everything else as the default.
Remember to verify your email as the recipient before messages can be sent!
-
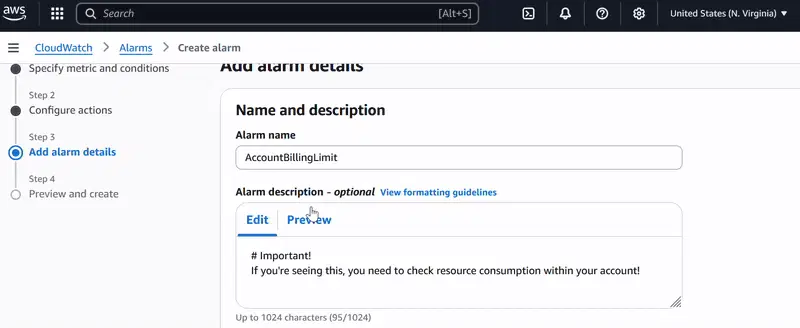
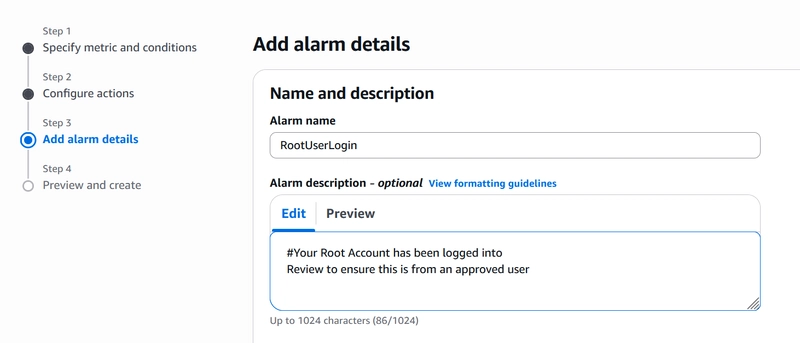
The next step, “Add Alarm details,” we give our Alarm a meaningful name. The alarm description is optional; however, it is good practice to set it up. It gives additional context to the alarm being received, especially where you have multiple alarms set up. The format of this body of text follows regular HTML rules.
-
Finally, Review all settings and create your alarm.
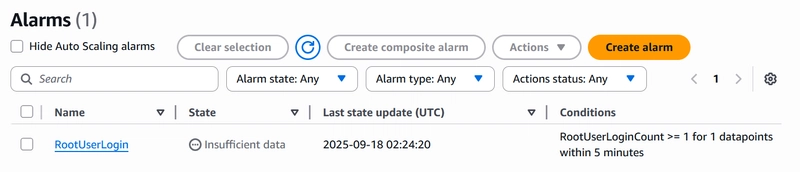
Once created, your alarm will appear in the CloudWatch dashboard, actively monitoring your AWS charges.
Using CloudWatch to monitor Root account usage
By default, AWS records the last 90 days of events within an account in the CloudTrail event history. However, the default events do not support triggering alerts, event metrics, and long-term storage. We thereby create a new trail and configure CloudWatch on it
Step 1 : Create CloudTrail Trail.
-
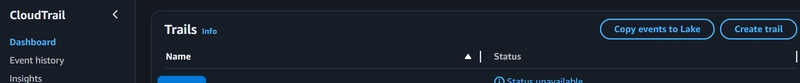
In the console, navigate to CloudTrail and select Create new trail.
-
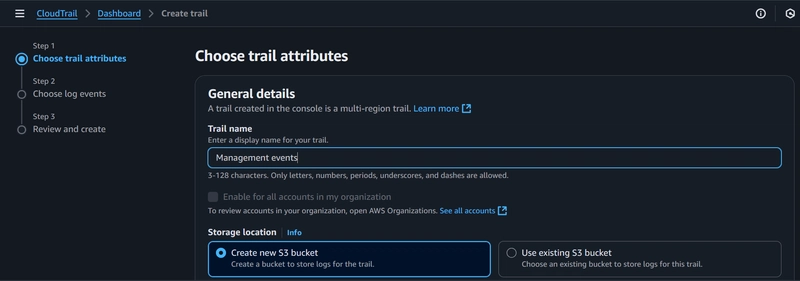
Under Step 1: Choose trail attributes:
- Create a name for your trail under Trail Name.
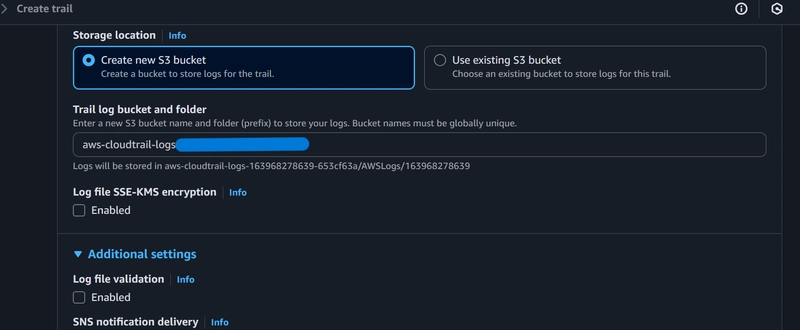
- Under Storage Location, select Create new bucket. This will serve as the destination of your trail logs. A bucket name would be automatically generated.
-
Ensure the options for Log file SSE-KMS encryption and Log file validation are unchecked.
This is disabled to save costs, reduce complexity, and avoid potential integration or permission challenges, especially in a low-risk environment. But in production, it’s best practice to enable both for security and audit integrity
-
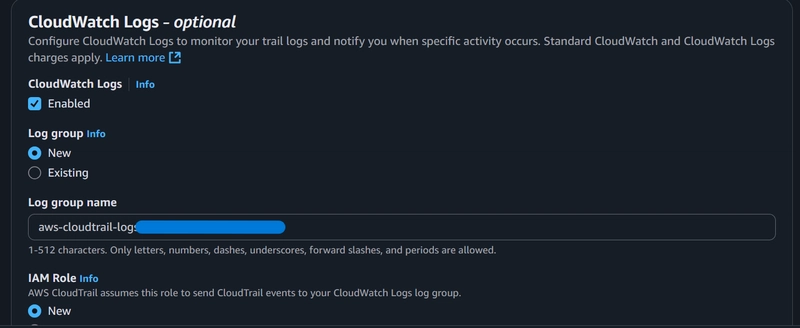
Under CloudWatch Logs;
-
Enable CloudWatch Logs
-
Select New under Log group. A log group name would be automatically generated for you. Ensure you take note of this name.
-
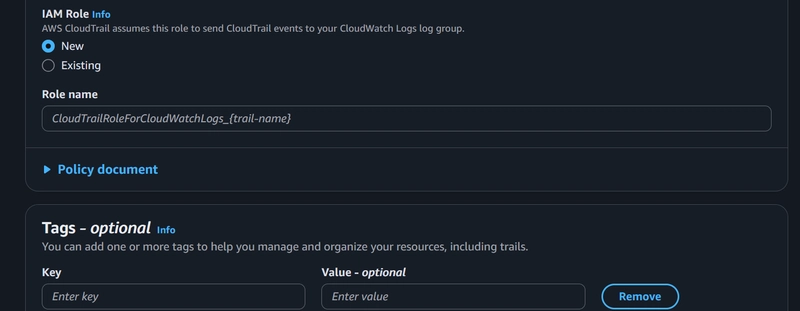
Under IAM Role select new. An IAM policy would be generated that allows CloudTrail to send events to your CloudWatch group. Name this role and move to the next step, ” Choose Log events”.
-
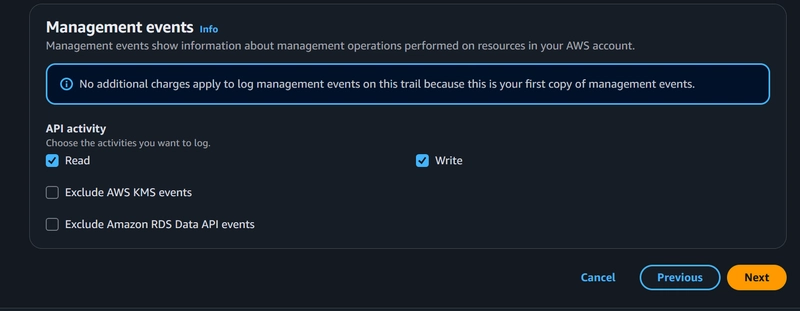
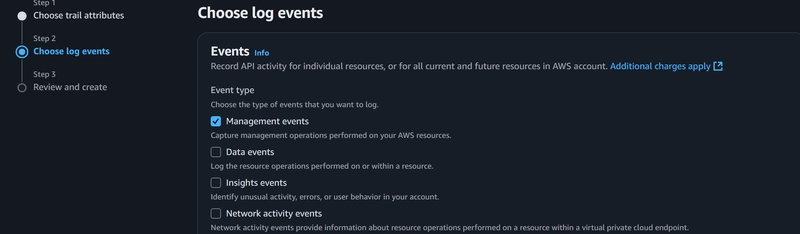
In Step 2: Choose Log events, select Management events under Events.
-
Scrolling down to Management Events, ensure Read and Write is checked.
-
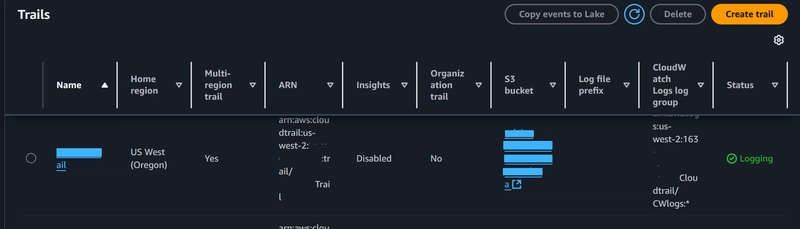
Review your changes and create the trail. Confirm your trail has been created in the CloudTrail dashboard.
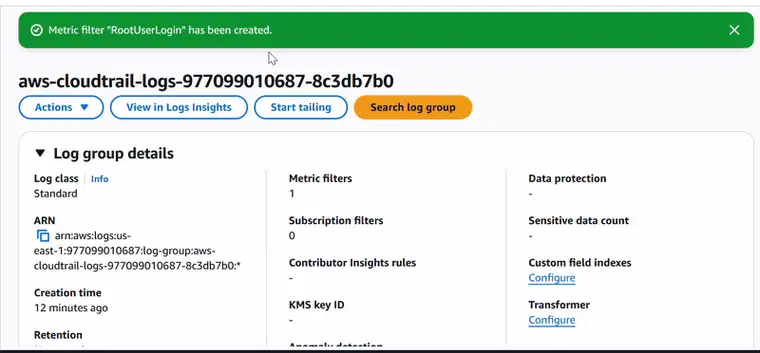
Step 2: Set up Metric Filter for Cloudwatch log group
-
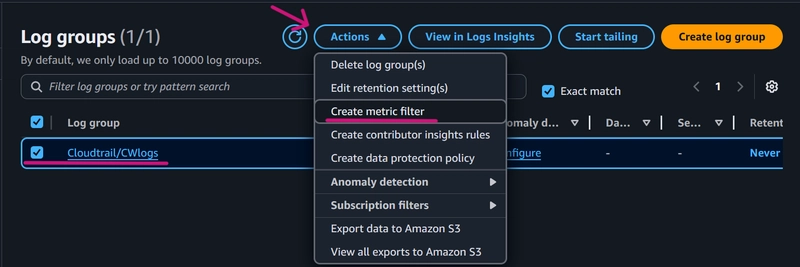
In CloudWatch, identify the log group you created in Step 1.
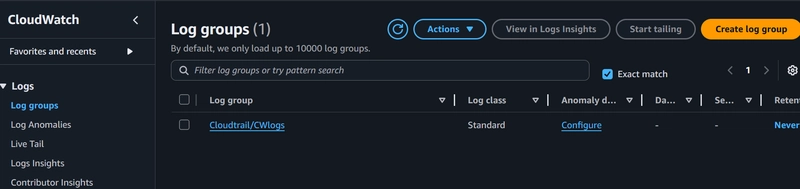
-
Select the log group, click Actions, and select the Create Metric Filter option.
-
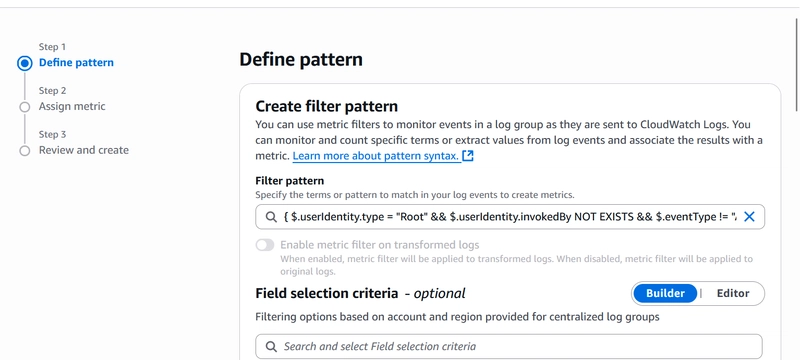
Here in Step 1: Define Pattern, we enter the following metric filter
{ $.userIdentity.type = "Root" && $.userIdentity.invokedBy NOT EXISTS && $.eventType != "AwsServiceEvent" }
#This filter will go through our CloudTrail log for root user login activity
Leave all other options as default and move to Step 2
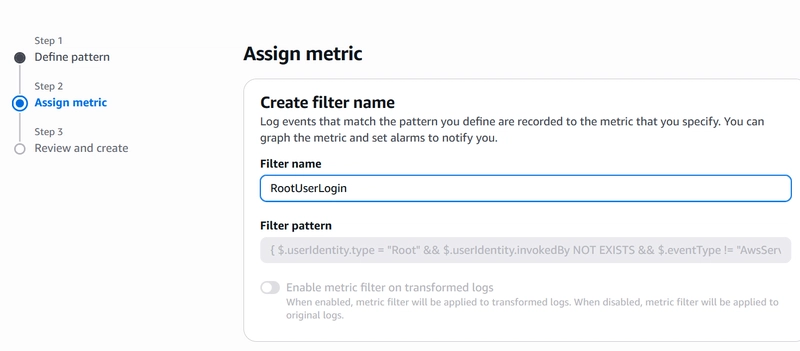
- In Step 2: Assign Metric, define a Filter name.
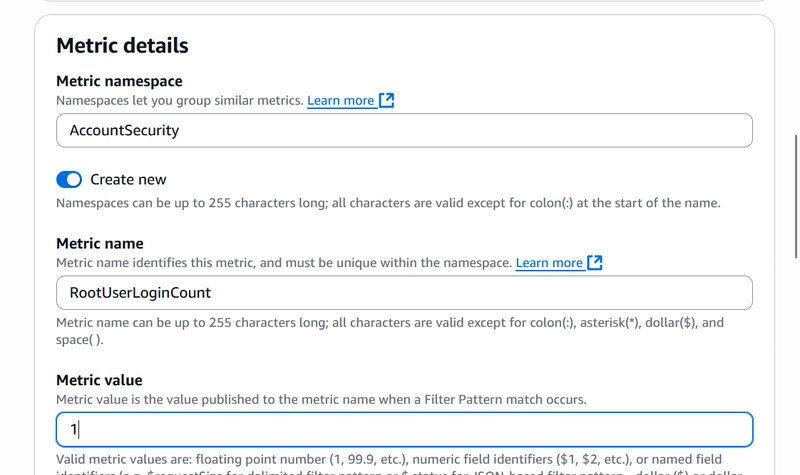
Under Metric Details, define;
A Metric Namespace (AccountSecurity)
A Metric Name (RootUserLoginCount)
A Metric Value (1)
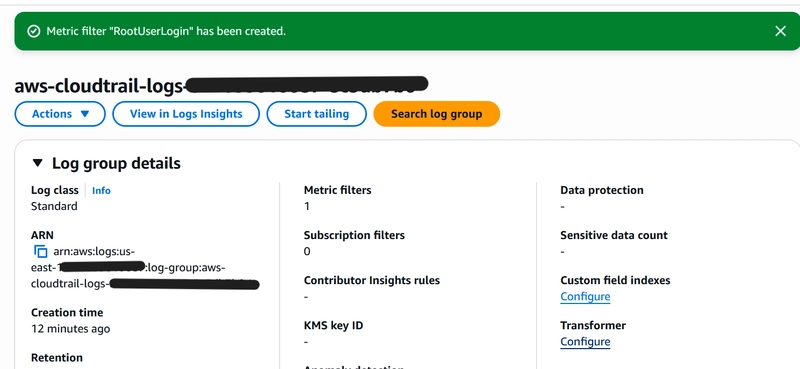
- Leave all other details as default and review your changes before making them. Your new metric filter will be immediately available!
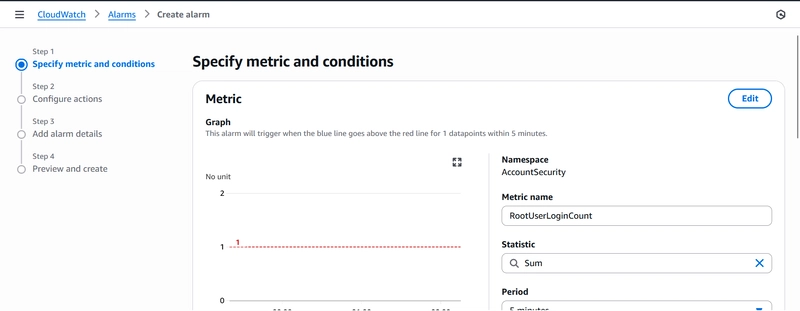
Step 3: Create CloudWatch Alarm based on MetricFilter
-
Once your Metric Filter becomes available, select it in your dashboard and create an alarm based on it. This will also be available under Metrics.
-
Ensure the right metric has been selected and Statistic is set to sum. Leave other details under metric as default.
-
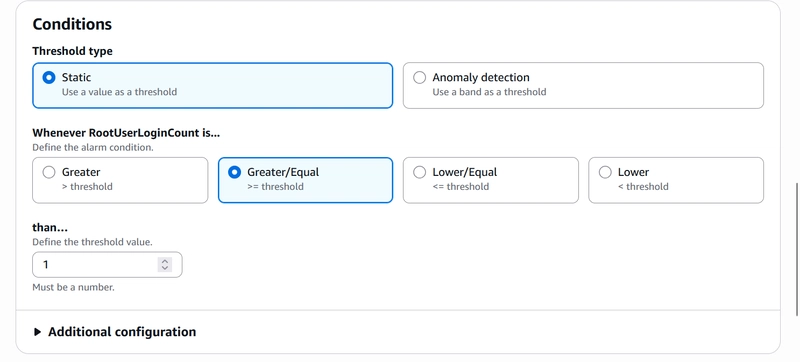
Under Conditions, set the following;
Threshold type : Static
Whenever metric (RootUserLoginCount) is : Greater/Equal
than…..: 1
Move to the next step.
- In Step 2: Configure actions, set Alarm state trigger as In Alarm.
Choose/Create an SNS Topic for the new alarm.
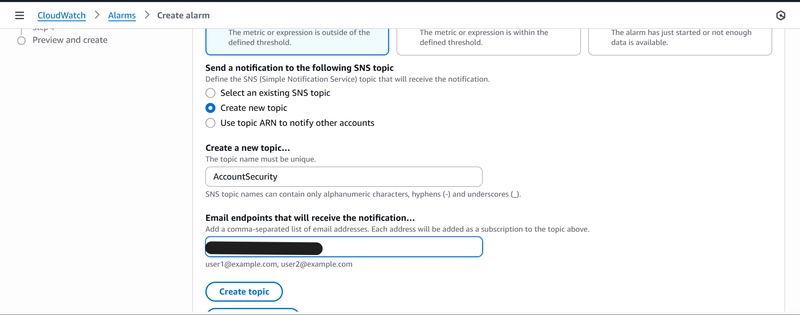
-
Add Alarm details
-
Review your changes and create your alarm.
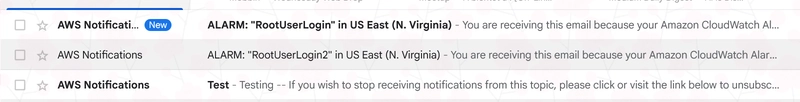
Now, it’s time to test! Log in to your root account to trigger the CloudWatch Alarm and notification.
Setting up CloudWatch Alerts is one of the best early steps you can take in securing your AWS account. It helps you stay in control of costs and spot suspicious activity before it escalates.
Challenge: Set up a CloudWatch metric filter and Alarm that checks for IAM Policy/Role changes. Comment what filter you came up with and let’s engage!
Troubleshoot corner
I am not receiving a notification after logging into my root account. Try the following;
-
Publish a message to the SNS topic designated for the RootUserLogin Alarm.
-
Ensure you are using the custom Metric Filter you created.
If this still fails, create a second alarm with the custom Metric Filter.
References